What's on this page
May 2026 in One Paragraph
One hundred eight homes closed through the MLS across Lake Nona's two ZIP codes in May, at a median of $705,000 in 32827 and $568,742 in 32832. For the first time in this year's reports, inventory did not build: 425 homes were on the market at month end against 455 a year earlier, and the count fell in both ZIP codes. At May's sales pace that is roughly 3.9 months of supply.
The two halves of Lake Nona got there in opposite ways. In 32832, single-family homes and attached homes each recorded their slowest May and their widest gap between original asking price and sale price anywhere in the plotted five-year range — 64 days and 116 days respectively. In 32827, both segments sold faster than their five-year May norm and closer to asking than a year ago. One market, two directions.
- 108 Closings
- 425 Active Listings
- 3.9 Months of Supply
- Inventory Down Year Over Year
- 49 & 77 Days Average
- 17% Cash Buyers
| Metric | 32827 | 32832 |
|---|---|---|
| Closed sales | 40 (down from 44 a year earlier) | 68 (down from 87 a year earlier) |
| Median sold price | $705,000 | $568,742 |
| Average sold price | $861,062 | $640,692 |
| Average days on market | 49 (down from 72) | 77 (up from 52) |
| Average sale-to-original-list | 95.5% | 94.7% |
| Active listings at month end | 223 (down 2.6% year over year) | 202 (down 10.6% year over year) |
| Months of supply | 5.6 | 3.0 |
| New listings | 76 | 75 |
| New pendings | 56 | 59 |
| All pendings | 85 | 88 |
| Sold dollar volume | $34,442,486 | $43,567,070 |
How Much Is For Sale, and How Does That Compare?
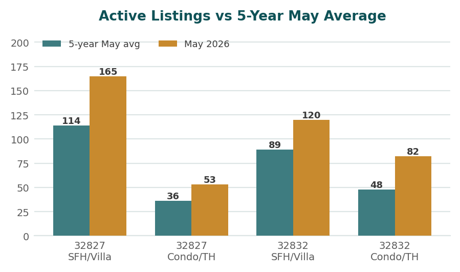
Lake Nona ended May with fewer homes for sale than a year earlier, and still about 46% more than a typical May of the past five years.
Both statements are true and neither cancels the other. 425 homes were listed at month end, down from 455 in May 2025, with the count falling in 32827 and falling harder in 32832. Measured against the five-year May average for each segment, though, supply is still well above normal, and the two attached segments each finished at the top of their plotted five-year May range.
The table adds a second comparison that a raw count cannot give you: months of supply now, against the same ratio built from each segment's five-year May averages for listings and sales. That is the closest this data comes to a normal reading.
| Segment | May 2026 actives | 5-year May average | Difference | Months of supply | At 5-year averages |
|---|---|---|---|---|---|
| 32827 single-family | 165 | 114 | +45% | 5.2 | 3.1 |
| 32827 condo / townhome | 53 | 36 | +47% | 8.8 | 4.0 |
| 32832 single-family | 120 | 89 | +35% | 2.4 | 1.8 |
| 32832 condo / townhome | 82 | 48 | +71% | 4.8 | 2.0 |
One reason not to read the percentages too literally. Lake Nona has added housing quickly over the past five years, so part of that gap against the five-year average is simply more homes existing rather than more homes struggling to sell. The stock-neutral measures — months of supply, days on market, the sale-to-original-list ratio and the contract ratio — carry the argument here, and this month they do not all point the same way. That divergence is the story.
Six months of supply is the conventional line between a buyer's and a seller's market. Lake Nona sat at roughly 3.9 months in May, with 32827 at 5.6 and 32832 at 3.0. Both are under the line at the ZIP level — but 32827's condo and townhome segment sits at about 8.8 months, more than double what its five-year May figures imply is normal.
What Does the May Data Mean if You're Buying?
You still have more to choose from than a normal May, but you have more company than you did a year ago.
Contract activity came back. Across the two ZIP codes there were 173 pending contracts at the end of May against 111 a year earlier, and the contract ratio — pending sales per active listing, which MarketStats reads as a demand-versus-supply gauge — rose year over year in every one of the four segments. That is a real change from the earlier months of this year.
What has not changed is the level. All four contract ratios still sit far below their own five-year May norms: 52% below in 32827 single-family, 87% below in 32827 condos and townhomes, 50% and 61% below on the 32832 side. Rising from a low base is still a low base, and the gap left to close is large.
Worth knowing if you are financing: only about 17% of May closings were cash — 18 of 108. Conventional loans covered 73, FHA eight and VA six. That is a low cash share, which means a well-qualified financed offer was not automatically at a disadvantage this month the way it is when a third of the market pays cash.
Where to be careful: speed is not evenly distributed. 36 of the 108 May sales — a third — closed within ten days of listing, and 15 of those at zero days on market, meaning they were effectively spoken for before they hit the MLS. Strip the zero-day sales out and the arithmetic average rises from 49 to about 61 days in 32827 and from 77 to about 86 in 32832. Well-priced and pre-sold homes still move immediately; the leverage sits with the aged inventory, and 24% of May's closings had been listed more than 120 days.
What Does the May Data Mean if You're Selling?
The average 32827 closing gave up 4.5% from its original asking price and the average 32832 closing 5.3% — and in 32832 that was the deepest May discount in the plotted five-year range for both single-family and attached homes.
The sale-to-original-list ratio came in at 95.5% in 32827 and 94.7% in 32832, and the direction matters more than the level. 32827 improved on last May's 94.1%. 32832 fell from 96.5% and landed at the bottom of its plotted five-year May range in both segments — 95.3% for single-family homes, 92.9% for condos and townhomes.
That figure also hides a two-step story. Measured as a ratio of averages, May closings came in at 96.1% of the original ask in 32827 and 94.3% in 32832, against 97.6% and 97.8% of the final ask. The difference — about a point and a half in 32827, three and a half in 32832 — is the reduction sellers made before an offer ever arrived. The rest came out of the negotiation.
New listings tell you what you are up against. Sellers brought 151 new listings to market in May against 108 closings, so supply still arrived faster than it cleared. The reason inventory fell anyway is 32832: new listings there dropped to 75 from 96 a year earlier, a 22% reduction in fresh competition. In 32827, new listings were flat at 76 against 75.
The number to plan around: average days on market ran 49 in 32827 and 77 in 32832. If you are selling in 32832, count backward from roughly three months plus closing time and price for a buyer who has seen your listing sit. If you are selling in 32827, the timeline is closer to normal — but 40 sales against 223 listings means most of that inventory did not sell at all.
If you own a condo or townhome, take particular note. Both attached segments ended May at the top of their five-year May range for active listings, and both attached medians came in below their five-year May averages while both single-family medians came in above. That combination — more competing supply, softer pricing — is the clearest signal in this month's data.
How Do 32827 and 32832 Compare?
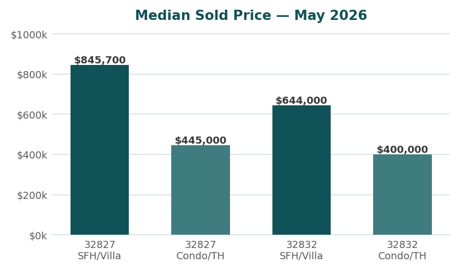
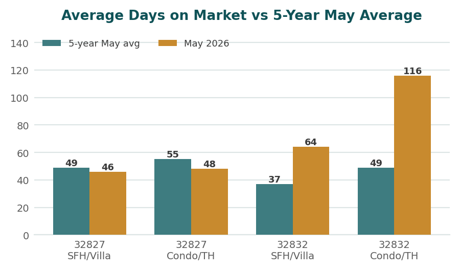
32827 is the higher-priced side and sold faster than its own norm; 32832 sold more homes but took longer and discounted deeper than in any May of the past five years.
One caution before the comparison: the 32827 condo and townhome median rests on just six sales, and a median drawn from six homes moves sharply on one unusual transaction. The 32832 single-family figure, built on 51 sales, is the most reliable of the four.
32827 covers the Laureate Park side and produced 40 closings at a $705,000 median, averaging 49 days on market and 5.6 months of supply. 32832 covers the Eagle Creek and Storey Park side and produced 68 closings at a $568,742 median, averaging 77 days and 3.0 months of supply.
| Segment | Median | 5-yr median | Avg days | 5-yr days | Sale-to-original-list | 5-yr ratio |
|---|---|---|---|---|---|---|
| 32827 single-family | $845,700 | $782,540 | 46 | 49 | 95.7% | 97.0% |
| 32827 condo / townhome | $445,000 | $463,739 | 48 | 55 | 94.3% | 95.4% |
| 32832 single-family | $644,000 | $597,869 | 64 | 37 | 95.3% | 97.9% |
| 32832 condo / townhome | $400,000 | $417,020 | 116 | 49 | 92.9% | 97.9% |
Read that table down the median columns and a pattern appears that cuts across the ZIP codes: both single-family medians came in above their five-year May average, and both attached medians came in below. Read it across the days and ratio columns and the split is by ZIP instead. Where you are and what you own are both doing work, and they are not doing the same work.
A note on 32827's headline price decline. The 32827 median fell 11.2% from May 2025 and the average fell 9.1%, and the usual explanation — a shift toward cheaper attached homes — does not apply. Attached homes were 15% of 32827 sales this May against 20% a year earlier, a shift that should have pushed the median up. Holding last year's mix constant, the average decline works out to 9.3% rather than 9.1% — if anything marginally worse, not better.
The source points somewhere more specific. Single-family homes with four or more bedrooms averaged $1,078,270 in May against $1,263,759 a year earlier, on 24 sales versus 25 — a like-for-like drop of about 15% in the segment that sets 32827's headline number. Three-bedroom single-family homes in the same ZIP rose 2.9%. The weakness in 32827 is concentrated at the top, not spread across the market.
Which Price Ranges Were Moving?
The $600,000 to $800,000 range led closings in both ZIP codes, and the deepest imbalance between listings and sales sits above $1 million in 32827.
| Price range | Sold, 32827 | Active, 32827 | Sold, 32832 | Active, 32832 |
|---|---|---|---|---|
| Under $300,000 | 0 | 0 | 1 | 5 |
| $300,000 – $399,999 | 1 | 17 | 9 | 34 |
| $400,000 – $499,999 | 8 | 26 | 17 | 54 |
| $500,000 – $599,999 | 2 | 21 | 10 | 37 |
| $600,000 – $799,999 | 12 | 38 | 19 | 32 |
| $800,000 – $999,999 | 9 | 40 | 2 | 11 |
| $1,000,000 and above | 8 | 76 | 10 | 29 |
Your own price range matters more than the market-wide figure. In 32827, 76 homes were listed above $1 million against eight that sold — roughly nine and a half months of supply, and 35% of everything listed in that ZIP code. In 32832 the same band carried 29 listings against 10 sales, under three months. The million-dollar market is not one market.
The tightest band anywhere in Lake Nona was 32832 between $600,000 and $800,000: 32 active listings against 19 closings, well under two months of supply. The loosest below the top end was 32832 at $400,000 to $500,000, where 54 listings competed for 17 sales.
Lake Nona is a large-home market, and May underlined it: 75 of the 106 closings with a bedroom count reported — 71% — had four or more bedrooms, 29 had three, and only two had two or fewer. Bedroom count drives price more than ZIP code does. In 32827 a three-bedroom single-family home averaged $626,125 while a four-plus averaged $1,078,270; in 32832 the same step ran $547,153 to $760,238.
What Should You Watch Next?
Whether 32832's discounting stabilises now that fewer sellers are listing there is the number that will tell you which way this market turns.
Two forces are pulling against each other. Fewer new listings in 32832 — 75 against 96 a year earlier — should relieve pressure on price over the coming months if it holds. Against that, 116-day average marketing times in the attached segment mean a lot of the inventory still on the market has been sitting a while, and aged listings tend to close at wider discounts than fresh ones. Watch whether the sale-to-original-list ratio in 32832 climbs back off the bottom of its range, and whether the contract ratios keep the year-over-year improvement they showed in May.
Thinking about buying or selling in Lake Nona? A market-wide median is a starting point, not an answer for your street, your price range or your kind of home — and this month those three things point in different directions depending on which side of Lake Nona you are on and whether your home is attached or detached. Call/Text David Myers at 407.801.3286, or use the contact form, for the numbers on a specific home or neighborhood.
Lake Nona Market: Frequently Asked Questions
What was the median home price in Lake Nona in May 2026?
It depends which part of Lake Nona and which kind of home. In 32827 the median sold price was $705,000 across all property types, and in 32832 it was $568,742. Broken out further: single-family homes ran an $845,700 median in 32827 and $644,000 in 32832, while condos and townhomes ran $445,000 and $400,000 respectively. The 32827 attached figure rests on only six closings, so treat it as indicative rather than precise.
Is Lake Nona a buyer's market or a seller's market in 2026?
May does not give one answer, and the honest reading is that the two ZIP codes are in different places. Across both, active inventory still ran about 46% above the five-year May average and the contract ratio sat 50% to 87% below its five-year May norm in every segment, which favours buyers. But inventory fell year over year in both ZIP codes, pending sales rose to 173 from 111, and 32827 sold faster than its own five-year May norm. Where they split: 32827 carries more supply relative to sales, at 5.6 months against 3.0, yet sells more quickly and closer to asking, while 32832 clears its inventory faster but took the deepest May discounts in its plotted five-year range.
How much inventory is there in Lake Nona right now?
There were 425 active listings at the end of May, 223 in 32827 and 202 in 32832, down from 455 a year earlier. Against 108 closings that month, that works out to roughly 3.9 months of supply overall, 5.6 months in 32827 and 3.0 months in 32832. Six months is the conventional dividing line between a buyer's and a seller's market, so both ZIP codes sit below it — but the 32827 condo and townhome segment sits well above at about 8.8 months.
How long does it take to sell a home in Lake Nona?
In May the average was 49 days in 32827 and 77 days in 32832, and the two moved in opposite directions from a year earlier — 32827 down from 72 days, 32832 up from 52. Both 32832 segments recorded their slowest May anywhere in the plotted five-year range: single-family homes averaged 64 days against a five-year May average of 37, and condos and townhomes averaged 116 days against 49.
How much below asking price are Lake Nona homes selling for?
The average May closing came in at 95.5% of the original list price in 32827 and 94.7% in 32832 — roughly 4.5% and 5.3% below where the seller started. In 32832 that was the widest May gap in the plotted five-year range, in both the single-family and the attached segment. In 32827 it was an improvement on the 94.1% recorded in May 2025.
How many homes sold in Lake Nona in May 2026?
One hundred eight homes closed through the MLS: 40 in 32827 and 68 in 32832. That is down from 131 in May 2025, and both ZIP codes also came in under their five-year May averages for closed sales. Volume fell while inventory fell alongside it, which is why months of supply still improved.
Does this report include new construction sales?
Only the new construction that was reported through the MLS. Builders frequently sell directly from a sales office without ever listing the home, and those closings do not appear in this data. Lake Nona is one of the most active new-construction markets in Orlando, so the true number of homes sold in May was almost certainly higher than the 108 counted here, and the resale market is represented more completely than the builder market.
How many Lake Nona buyers pay cash?
About 17% of May closings were cash — 18 of 108. Conventional financing accounted for 73 sales, with FHA covering eight and VA six. A cash share near one in six is on the low side for this market, which means most contracts this month carried an appraisal and a financing contingency, and a well-qualified financed buyer was not automatically at a disadvantage.
Are condos and townhomes a better value in Lake Nona than single-family homes?
They carry a much lower entry price — a $400,000 median in 32832 and $445,000 in 32827, against $644,000 and $845,700 for single-family homes. But attached housing is where this market is softest. Both condo and townhome segments ended May at the top of their plotted five-year range for active listings, 32832's attached homes averaged 116 days to sell, and attached medians in both ZIP codes came in below their five-year May averages while single-family medians came in above. More choice for a buyer, more competition for a seller.
Where these numbers come from. MarketStats by ShowingTime, Local Market Insight and Detailed Report editions for ZIP codes 32827 and 32832, May 2026. Data source: Stellar MLS. Statistics calculated July 07, 2026.
New construction is under-counted. Builders often sell directly from a sales office without listing the home on the MLS, and those closings never enter this data. Lake Nona is one of the most active new-construction markets in the region, so the real number of homes sold in May was very likely higher than 108. That matters most for months of supply, which divides listings by sales: if sales are under-counted, the supply figure reads higher than the true one. It also inflates the cash share, since builder buyers skew financed. The resale market is represented far more completely here than the builder market.
ZIP codes are not neighborhood boundaries. 32827 and 32832 are the closest available proxy for the Lake Nona area, but each covers ground that residents would not call Lake Nona, and no ZIP boundary lines up with a neighborhood. For what a specific community is doing, a neighborhood-level look will beat a ZIP-level one every time.
Small samples move a lot. Some segments here rest on very few sales — the 32827 condo and townhome median comes from six closings, and its year-ago comparison from nine. Single-month changes in a segment that thin are directional at best. The 32832 single-family figures, built on 51 sales, are the most reliable in this report.
On "at the top of the five-year range." The Local Market Insight reports plot each figure against a five-year range for the same month. Where this report says a segment is at the top or bottom of its range, it means the May 2026 reading sits at the end of that plotted range. Segment-level counts in 32827 sum to 38 closings and 218 active listings against ZIP-level totals of 40 and 223, because a small number of records fall outside the single-family and attached property-type breakdowns; that is also why the bedroom mix totals 106 rather than 108.
On the "at 5-year averages" column. That column is months of supply calculated from each segment's published five-year May average for active listings and its published five-year May average for closed sales. It is a derived comparison, not a figure the source publishes, and it is offered as a rough baseline rather than a precise historical value.
Two definitions worth knowing. Days on market and the sale-to-original-list ratio are reported here as averages, which is how the source publishes them; a small number of long-listed or deeply discounted homes pulls an average further than it would a median. The contract ratio is pending sales divided by active listings, so a falling ratio means contract activity is shrinking relative to supply.
On combining the two ZIP codes. Counts such as closings, active listings and months of supply are added across ZIP codes. Median prices are not, because a median of two medians is not a median — those are reported separately throughout, which is also the more useful comparison given how differently the two areas behaved this month.
Market data is subject to revision and individual results vary. This is general market information, not advice on a specific property or transaction.