What's on this page
February 2026 in One Paragraph
Sixty-seven homes closed through the MLS across Lake Nona's two ZIP codes in February, at a median of $690,000 in 32827 and $635,000 in 32832. Across the four segments this report tracks, that is 66 closings against a five-year February average of 67 — almost exactly normal in total, but distributed nothing like normal. 32827 ran about nine sales above its five-year February norm while 32832 ran about ten below.
Two things every segment shares. Inventory: 387 homes were still on the market at month end, roughly 63% above the five-year February average, with single-family listings in 32827 and attached listings in 32832 each at the top of their plotted five-year range. And contract activity: pending sales per active listing ran between 62% and 89% below the five-year February average in all four segments. What is no longer shared is speed. Three of the four segments sold within about 12% of their normal February pace; the exception, condos and townhomes in 32827, averaged 212 days.
- 67 Closings
- 387 Active Listings
- 5.8 Months of Supply
- Contract Ratios 62–89% Below Norm
- 9.3 Months in 32832 Attached
- 28% Cash Buyers
| Metric | 32827 | 32832 |
|---|---|---|
| Closed sales | 38 (up from 21 a year earlier) | 29 (down from 31 a year earlier) |
| Median sold price | $690,000 | $635,000 |
| Average sold price | $829,503 | $683,295 |
| Average days on market | 106 | 51 |
| Average sale-to-original-list | 93.2% | 96.6% |
| Active listings at month end | 181 (up 13.8% year over year) | 206 (up 6.2% year over year) |
| Months of supply | 4.8 | 7.1 |
| New listings | 57 | 56 |
| New pendings | 39 | 62 |
| All pendings | 57 | 75 |
| Sold dollar volume | $31,521,098 | $19,815,562 |
How Much Is For Sale, and How Does That Compare?
Lake Nona ended February with about 63% more homes for sale than its five-year February average, and two of the four segments finished at the very top of their plotted five-year range.
387 homes were on the market at month end. The two segments at the end of their range are single-family homes in 32827, at 139, and condos and townhomes in 32832, at 84. The other two came close without reaching it: 32827's attached inventory at 39 against a range top of 41, and 32832's single-family inventory at 122 against 128.
| Segment | Closed sales | Median sold price | Active listings | Months of supply |
|---|---|---|---|---|
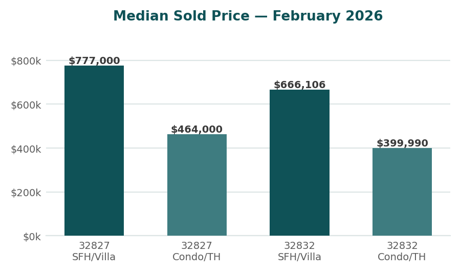
| 32827 single-family | 29 | $777,000 | 139 | 4.8 |
| 32827 condo / townhome | 8 | $464,000 | 39 | 4.9 |
| 32832 single-family | 20 | $666,106 | 122 | 6.1 |
| 32832 condo / townhome | 9 | $399,990 | 84 | 9.3 |
A raw count means little without a baseline, which is what makes the next table the most useful one in the report. It sets each segment against its own five-year February average, so nothing here depends on comparing 32827 with 32832.
| Segment | Active listings | Average days on market | Sale-to-original-list | Contract ratio |
|---|---|---|---|---|
| 32827 single-family | 139 vs 89 — up 56%, at the top of the range | 75 vs 78 — 3% below | 93.7% vs 96.0% — at the bottom of the range | 0.30 vs 1.19 — 75% below |
| 32827 condo / townhome | 39 vs 28 — up 39% | 212 vs 94 — 126% above, at the top of the range | 91.2% vs 96.2% — at the bottom of the range | 0.36 vs 2.46 — 85% below |
| 32832 single-family | 122 vs 77 — up 58% | 53 vs 50 — 6% above | 96.0% vs 97.1% | 0.39 vs 1.02 — 62% below |
| 32832 condo / townhome | 84 vs 41 — up 105%, at the top of the range | 45 vs 40 — 12% above | 97.8% vs 98.5% | 0.33 vs 2.92 — 89% below |
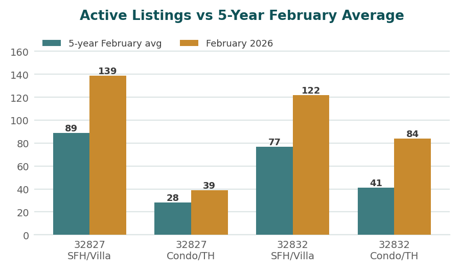
Read across the rows rather than down the columns and the month has a clear shape. Every segment is carrying far more inventory than normal and writing far fewer contracts against it than normal. But only one segment is also selling slowly, and only in 32827 are sellers giving up unusual amounts of price. Those are three different problems, and they are not evenly distributed.
Two reasons not to read those numbers too literally. First, Lake Nona has added housing quickly over the past five years, so part of any inventory increase is simply more homes existing rather than more homes struggling to sell. That caveat applies to the active-listing column and to months of supply; it does not apply to days on market, the sale-to-original-list ratio, or the contract ratio, which is why those carry the argument here.
Second, months of supply divides listings by a single month of sales, and February's sales moved a long way in both directions — 32827 went from 26 closings in January to 38, while 32832 went from 42 to 29. Inventory itself barely moved, and in 32832 it actually fell, from 214 listings to 206. Most of the swing in months of supply is the denominator.
Six months of supply is the conventional line between a buyer's and a seller's market. Lake Nona sat at roughly 5.8 months in February, with 32832 above the line at 7.1 and 32827 below it at 4.8. In January the positions were reversed. Anyone reading either figure as a trend from one month is reading too much into it; what has held for a year is the inventory build, not the month-to-month supply figure.
What Does the February Data Mean if You're Buying?
Contract activity ran 62% to 89% below its five-year February norm in every Lake Nona segment, so you are competing with far fewer other buyers than usual for a much larger pool of homes.
The contract ratio — pending sales per active listing, which folds demand and supply into one number — is the measure to weight most heavily, because unlike a raw listing count it is unaffected by how much new housing has been built. MarketStats reads a falling ratio as the market moving in the buyer's favour, and in February it was down across the board: 0.30 against a five-year February average of 1.19 for single-family homes in 32827, 0.39 against 1.02 in 32832, and 0.36 against 2.46 and 0.33 against 2.92 in the two attached segments. Even the least depressed of those, 32832 single-family, is 62% below normal.
Where you can expect to convert that into price depends heavily on which segment you are shopping. In 32827, single-family homes closed at an average of 93.7% of their original asking price and condos and townhomes at 91.2%, both at the bottom of their plotted five-year February range. In 32832 the same figures were 96.0% and 97.8% — below their norms, but only slightly. On a home at 32827's $777,000 single-family median, the 2.3-point gap against the five-year norm is about $18,000; on a 32832 condo it is closer to nothing.
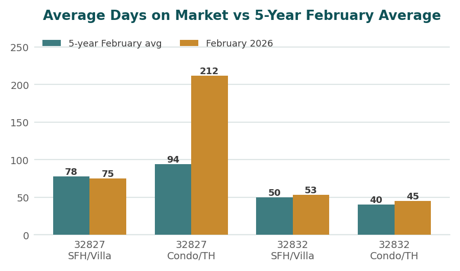
Time on market is where February differed most from January. Three of the four segments came back close to their five-year February pace: 75 days for 32827 single-family (3% under the norm), 53 days for 32832 single-family (6% over), 45 days for 32832 attached (12% over). The exception is stark. Condos and townhomes in 32827 averaged 212 days, 126% above their 94-day norm and the slowest February reading in the plotted five-year range. If you are buying an attached home on that side of Lake Nona, the aged inventory is where your leverage sits.
Worth knowing if you are financing: about 28% of February closings were cash — 19 of 67. Conventional loans covered 39. There were three FHA loans and two VA loans in the whole month, all five in 32827; not one of the 29 closings in 32832 used FHA or VA financing. That does not mean those loans are unwelcome there, but it is a thin track record to point to when your offer is being compared with a cash one.
Where to be careful: 7 of the 67 February sales closed at zero days on market and another nine within ten days, so roughly a quarter of the month's activity was effectively over within ten days of listing. Well-priced homes still move. The negotiating room is in the aged inventory, and 32827 holds most of it — 13 of its 38 sales took more than 120 days, against 4 of 29 in 32832.
What Does the February Data Mean if You're Selling?
Sellers brought 113 new listings to market against 67 closings, and all four segments closed below their five-year February sale-to-original-list average.
Start with the arithmetic that drives everything else: 113 new listings against 67 sales. Supply outran demand for the second month running, which is why active inventory stayed near five-year highs even in a month when 32827 closed nearly twice as many homes as it did last February.
The discount comes in two steps, and the second one is the one sellers underestimate. In 32827 the average sold price was 91.3% of the average original list price but 93.8% of the average final list price — so about two and a half points came off the asking price before an offer ever arrived, and the rest came out of negotiation. In 32832 the same pair reads 96.1% and 98.6%: an identical two-and-a-half-point pre-offer cut, on a much smaller total discount. Sellers on both sides are cutting first and negotiating second. The difference is how much is left to negotiate once they have.
The number to plan around is your segment's, not Lake Nona's. Single-family sellers should budget roughly two months of marketing plus closing time in both ZIP codes — 75 days in 32827, 53 in 32832. Attached sellers in 32832 are at 45 days. Attached sellers in 32827 are at 212, up from 80 days in January.
If you own a condo or townhome in 32832, your problem is volume rather than price. That segment carried 84 active listings against nine sales — 9.3 months of supply, the deepest in Lake Nona, and an active count at the top of its five-year February range — with 70 of those 84 listings priced between $300,000 and $500,000. Yet the homes that did sell went at 97.8% of their original asking price in 45 days, the best pair of numbers in the market. Getting shown is the hurdle, not getting a fair price once you are.
If you own a condo or townhome in 32827, the reverse applies. Only 39 listings compete with you, but the segment averaged 212 days and 91.2% of original list. That is a pricing problem, not a competition problem.
How Do 32827 and 32832 Compare?
32827 sold well above its normal February volume and conceded unusual amounts of price to do it; 32832 sold well below its normal volume but held close to asking.
32827 covers the Laureate Park side and produced 38 closings at a $690,000 median, averaging 106 days on market and 4.8 months of supply. 32832 covers the Eagle Creek and Storey Park side and produced 29 closings at a $635,000 median, averaging 51 days and 7.1 months of supply.
| Segment | February 2026 | February 2025 | Change | Sales behind the figure |
|---|---|---|---|---|
| 32832 single-family | $666,106 | $742,500 | −10.3% | 20 this year, 20 last year |
| 32827 single-family | $777,000 | $915,500 | −15.1% | 29 this year, 18 last year |
| 32832 condo / townhome | $399,990 | $377,000 | +6.1% | 9 this year, 11 last year |
| 32827 condo / townhome | $464,000 | $493,600 | change not reported here | 8 this year, 2 last year |
The rows are ordered by how much weight the change deserves. 32832 single-family is the only comparison in Lake Nona built on twenty sales in both periods, and it is down 10.3%. That is the single most reliable price reading on this page. The 32827 single-family figure rests on 18 sales a year ago, thin but usable. The two attached comparisons rest on 11 and 2 sales respectively; the second is not a comparison at all, which is why no percentage appears for it.
Why 32832's headline median rose 21% when neither of its segments did. The ZIP-wide median went from $525,000 to $635,000, but single-family homes there fell 10.3% and condos and townhomes rose 6.1%. Nothing in between produces a 21% rise; what produced it was the mix. Attached sales dropped from 11 to 9, and among detached homes, three-bedroom sales fell from nine to one while four-or-more-bedroom sales rose from 11 to 19. More large homes and fewer small ones lifts the middle of the list without lifting any individual home's value. Read the ZIP-wide figure as composition, and the segment figures as price.
And why 32827's average price decline overstates things. The reported average fell 7.6% year over year, but the attached share of sales doubled, from 2 of 21 last February to 8 of 38 this year. Attached homes averaged $451,874 and detached homes $947,624, so a shift of that size drags the average down on its own. Holding last February's property mix constant, the average is roughly flat — about 0.3% higher, not 7.6% lower. Twenty-one sales is also a small base year; treat any percentage built on it as directional.
Where the two ZIP codes genuinely diverge is at the top, and there the samples are large enough to trust. Four-or-more-bedroom single-family homes averaged $1,157,164 in 32827, on 19 sales against 13 a year earlier — up about 4%. The same segment in 32832 averaged $838,642 on 19 sales against 11, down about 22%. Two adjacent ZIP codes, the same property type, opposite directions.
Which Price Ranges Were Moving?
The two ZIP codes have their inventory problem at opposite ends: entry-level in 32832, the top of the market in 32827.
| Price range | Sold, 32827 | Active, 32827 | Sold, 32832 | Active, 32832 |
|---|---|---|---|---|
| Under $300,000 | 2 | 0 | 2 | 6 |
| $300,000 – $399,999 | 3 | 12 | 3 | 36 |
| $400,000 – $499,999 | 8 | 23 | 4 | 53 |
| $500,000 – $599,999 | 1 | 9 | 5 | 31 |
| $600,000 – $799,999 | 10 | 44 | 8 | 35 |
| $800,000 – $999,999 | 5 | 27 | 4 | 14 |
| $1,000,000 and above | 9 | 63 | 3 | 31 |
Your own price range matters more than the market-wide figure. In 32832, the $300,000 to $500,000 band carried 89 active listings against seven sales — close to thirteen months of supply at February's pace, and the single most crowded stretch of the Lake Nona market. Between $600,000 and $1 million that same ZIP code looks entirely different: 49 listings against 12 sales, roughly four months. Above $1 million it slows again, to 31 listings against three sales.
32827 has the mirror image. Its $1 million and above band held 63 active listings against nine sales, about seven months of supply, while the $400,000 to $500,000 band cleared eight sales against 23 listings, under three months. The high end is where 32827's discounting is concentrated, and it is also where the market is largest — 14 of its 38 February closings were above $800,000.
Lake Nona is a large-home market, and February underlined it. Of the 66 closings with a bedroom count in the source, 40 — 61% — had four or more bedrooms, 22 had three, and four had two or fewer. Bedroom count drives price more than ZIP code does: in 32827 a three-bedroom single-family home averaged $549,500 against $1,157,164 for a four-plus, and in 32832 four-plus single-family homes averaged $838,642. Only one three-bedroom single-family home sold in 32832 all month, so no average is quoted for it here.
Timing followed the same split. About a quarter of February's closings sold within ten days of listing, and another quarter sat more than 120 days. Both extremes existed in the same month, and which one a given home falls into is mostly a question of price.
What Should You Watch Next?
Whether 32827's sale-to-original-list ratios lift off the floor of their five-year range during the spring is the number that matters most.
The near-term direction is already partly written. 32832 wrote 62 new pending sales against 29 closings, with both segments above their five-year February averages — 37 against 34 on the single-family side and 25 against 18 on the attached side. Contracts written in February close in March and April, so February's low closing count looks like timing rather than demand. 32827 runs the other way: 26 new single-family pendings against a five-year February average of 35.
Price is the harder question. Both 32827 segments sit at the bottom of their plotted five-year February range on sale-to-original-list, and that is not a seasonal artifact — it is what happens when inventory has been building for a year and sellers begin meeting the market. If those ratios recover through spring while inventory flattens, February was the trough. If they stay where they are while new listings keep outrunning contracts, the discounting spreads to 32832, where sellers have so far given up very little.
The second thing to watch is narrower: 32827's attached segment at 212 days. It is one of only four Lake Nona segments and it rests on eight sales, so a single month proves nothing. Two more months at that level would.
Thinking about buying or selling in Lake Nona? A market-wide median is a starting point, not an answer for your street, your price range or your kind of home — and this month the four segments point in four different directions. Call/Text David Myers at 407.801.3286, or use the contact form, for the numbers on a specific home or neighborhood.
Lake Nona Market: Frequently Asked Questions
What was the median home price in Lake Nona in February 2026?
It depends which part of Lake Nona and which kind of home. In 32827 the median sold price was $690,000 across all property types, and in 32832 it was $635,000. By segment: single-family homes ran a $777,000 median in 32827 and $666,106 in 32832, while condos and townhomes ran $464,000 and $399,990. Both condo and townhome figures rest on fewer than ten sales, so treat the single-family medians as the more reliable pair.
Is Lake Nona a buyer's market or a seller's market in 2026?
February still points to a buyer's market. The clearest evidence is the contract ratio, which counts pending sales per active listing: all four Lake Nona segments ran between 62% and 89% below their five-year February averages. Active inventory sat about 63% above the five-year February average, and every segment closed below its five-year February sale-to-original-list average. What has changed since January is speed, which returned close to normal in three of the four segments.
How much inventory is there in Lake Nona right now?
There were 387 active listings at the end of February, 181 in 32827 and 206 in 32832. Against 67 closings that month, that works out to roughly 5.8 months of supply overall, 4.8 months in 32827 and 7.1 months in 32832. Single-family listings in 32827 and condo and townhome listings in 32832 both finished at the top of their plotted five-year February range. By segment, months of supply ran 4.8 and 4.9 in 32827 and 6.1 and 9.3 in 32832.
How long does it take to sell a home in Lake Nona?
Three of the four segments came back close to normal in February. Single-family homes averaged 75 days in 32827, 3% under their five-year February norm, and 53 days in 32832, 6% above. Condos and townhomes in 32832 averaged 45 days, 12% above. The exception is large: condos and townhomes in 32827 averaged 212 days, 126% above their 94-day norm and the slowest reading in the plotted five-year February range.
How much below asking price are Lake Nona homes selling for?
The average February closing came in at 93.2% of the original list price in 32827 and 96.6% in 32832, so roughly 7% and 3% below where the seller started. All four segments finished below their five-year February average on this measure, but the gap is concentrated in 32827: single-family homes closed at 93.7% and condos and townhomes at 91.2%, both at the bottom of their plotted five-year February range. In 32832 the same figures were 96.0% and 97.8%.
How many homes sold in Lake Nona in February 2026?
Sixty-seven homes closed through the MLS: 38 in 32827 and 29 in 32832. Across the four segments the report tracks, that is 66 closings against a five-year February average of 67 — but the distribution flipped, with 32827 running about nine sales above its norm and 32832 about ten below. The 32827 count is up from 21 a year earlier, a base small enough that the percentage change is not reliable.
Does this report include new construction sales?
Only the new construction that was reported through the MLS. Builders frequently sell directly from a sales office without ever listing the home, and those closings do not appear in this data. Lake Nona is one of the most active new-construction markets in Orlando, so the true number of homes sold in February was almost certainly higher than the 67 counted here, and the resale market is represented more completely than the builder market.
How many Lake Nona buyers pay cash?
About 28% of February closings were cash, 19 of 67. Conventional financing accounted for 39 sales, with three FHA loans and two VA loans, all five of those in 32827. Not one of the 29 closings in 32832 used FHA or VA financing in February, which is worth knowing if that is how you plan to buy on that side of Lake Nona.
Why did the 32832 median rise 21% when both its segments say otherwise?
Because the mix of homes that sold changed more than values did, and the segment figures prove it. The 32832 single-family median fell 10.3% year over year, to $666,106 from $742,500, on 20 sales in each period. The condo and townhome median rose 6.1%. Neither segment came close to rising 21%; the ZIP-wide figure did only because attached sales dropped from 11 to 9 and three-bedroom detached sales fell from nine to one, tilting the mix toward larger, costlier homes.
Where these numbers come from. MarketStats by ShowingTime, Local Market Insight and Detailed Report editions for ZIP codes 32827 and 32832, February 2026. Data source: Stellar MLS. Statistics calculated July 07, 2026.
New construction is under-counted. Builders often sell directly from a sales office without listing the home on the MLS, and those closings never enter this data. Lake Nona is one of the most active new-construction markets in the region, so the real number of homes sold in February was very likely higher than 67. That matters most for months of supply, which divides listings by sales: if sales are under-counted, the supply figure reads higher than the true one. It also pushes the cash share down, since builder buyers skew toward financing. The resale market is represented far more completely here than the builder market.
ZIP codes are not neighborhood boundaries. 32827 and 32832 are the closest available proxy for the Lake Nona area, but each covers ground that residents would not call Lake Nona, and no ZIP boundary lines up with a neighborhood. For what a specific community is doing, a neighborhood-level look will beat a ZIP-level one every time.
Small samples move a lot. February is a light month, and the thinnest figures on this page are the two condo and townhome medians, which rest on eight sales in 32827 and nine in 32832. Year-over-year bases are thinner still: the 32827 attached segment is compared against just two sales in February 2025, which is why no percentage change is published for it. All 32827 year-over-year figures rest on 21 total sales a year ago and are directional at best. The 32832 three-bedroom single-family average is omitted entirely because only one such home sold.
On "at the top of the five-year range." The Local Market Insight reports plot each figure against a five-year range for the same month. Where this report says a segment is at the top or bottom of its range, it means the February 2026 reading sits at the end of that plotted range. Segment-level listing counts sum to 384 against a ZIP-level total of 387, because three active listings in 32827 fall outside the single-family and attached property-type breakdowns; the same applies to one closed sale in 32827, which is why the four segments total 66 closings and the bedroom mix totals 66 rather than 67.
Two definitions worth knowing. Days on market and the sale-to-original-list ratio are reported here as averages, which is how the source publishes them; a small number of long-listed or deeply discounted homes pulls an average further than it would a median. The contract ratio is pending sales divided by active listings, so a falling ratio means contract activity is shrinking relative to supply.
On combining the two ZIP codes. Counts such as closings, active listings and months of supply are added across ZIP codes. Median prices are not, because a median of two medians is not a median — those are reported separately throughout, which is also the more useful comparison given how differently the two areas behaved this month.
Market data is subject to revision and individual results vary. This is general market information, not advice on a specific property or transaction.